A nonlinear (chaotic) system is one that is reasonably predictable, but not exactly predictable. Take weather as an example. In Minnesota and Ohio, it is reasonable to assert that it will be warmer in the summer than in the winter. However, it is not unheard of to have a 70 degree day in February. In fact, once when I lived in MN, it did get above 70 degrees one day in February of 2002. I remember that vividly because I took advantage of the weather and bought a new motorcycle. And here in Columbus,in July of 2014, the temperature didn’t get above 70 degrees for several days in a row and our public pool was closed.
The fact is that the future states of nonlinear systems are inherently dependent on (determined by) the present states of the system. For example, it is impossible to know the temperature, pressure, humidity, particulate count and velocity of every 1 cubic voxel of the atmosphere. Therefore, with weather, we can know the present states approximately at best. Knowing the present state approximately therefore only approximately determines the future state, and for only very brief time. That’s why most weather forecasts are only accurate for a precious few hours into the future and even then, that accuracy isn’t much more than 50% (it’s either sunny or it’s not – it rains or it doesn’t).
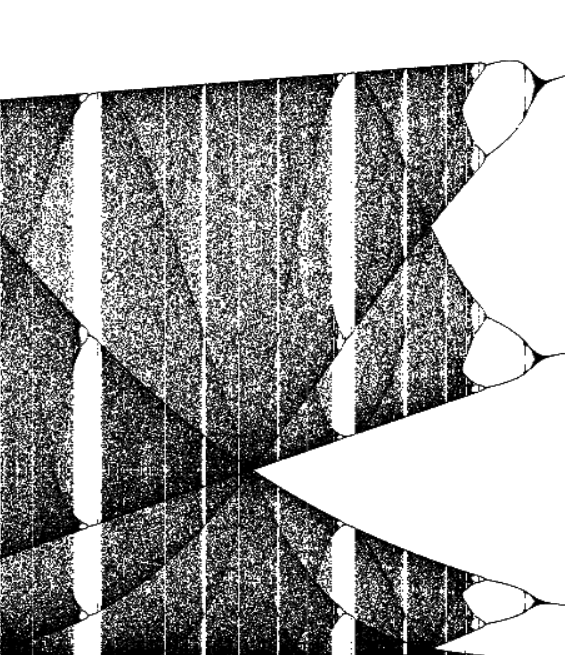
Nonlinear systems also have a proclivity for rapid change of state as illustrated by the bifurcation diagram for a UAB oscillator. Each column of pixels in the diagram can be thought of as states of the system. Note that there are many states towards the left side of the diagram, but that as the gain of the system is increased there ends up being only 2 states as shown in the far right of the diagram.